

General Analytics
Use these insights to focus effort where it drives the greatest impact.
Our dashboard turns raw activity into plain-English answers. Powerful filters, growth-trend visuals, and “Top 5” snapshots let you see where visitors come from, what they click, and which partners drive pipeline—all without exporting spreadsheets.
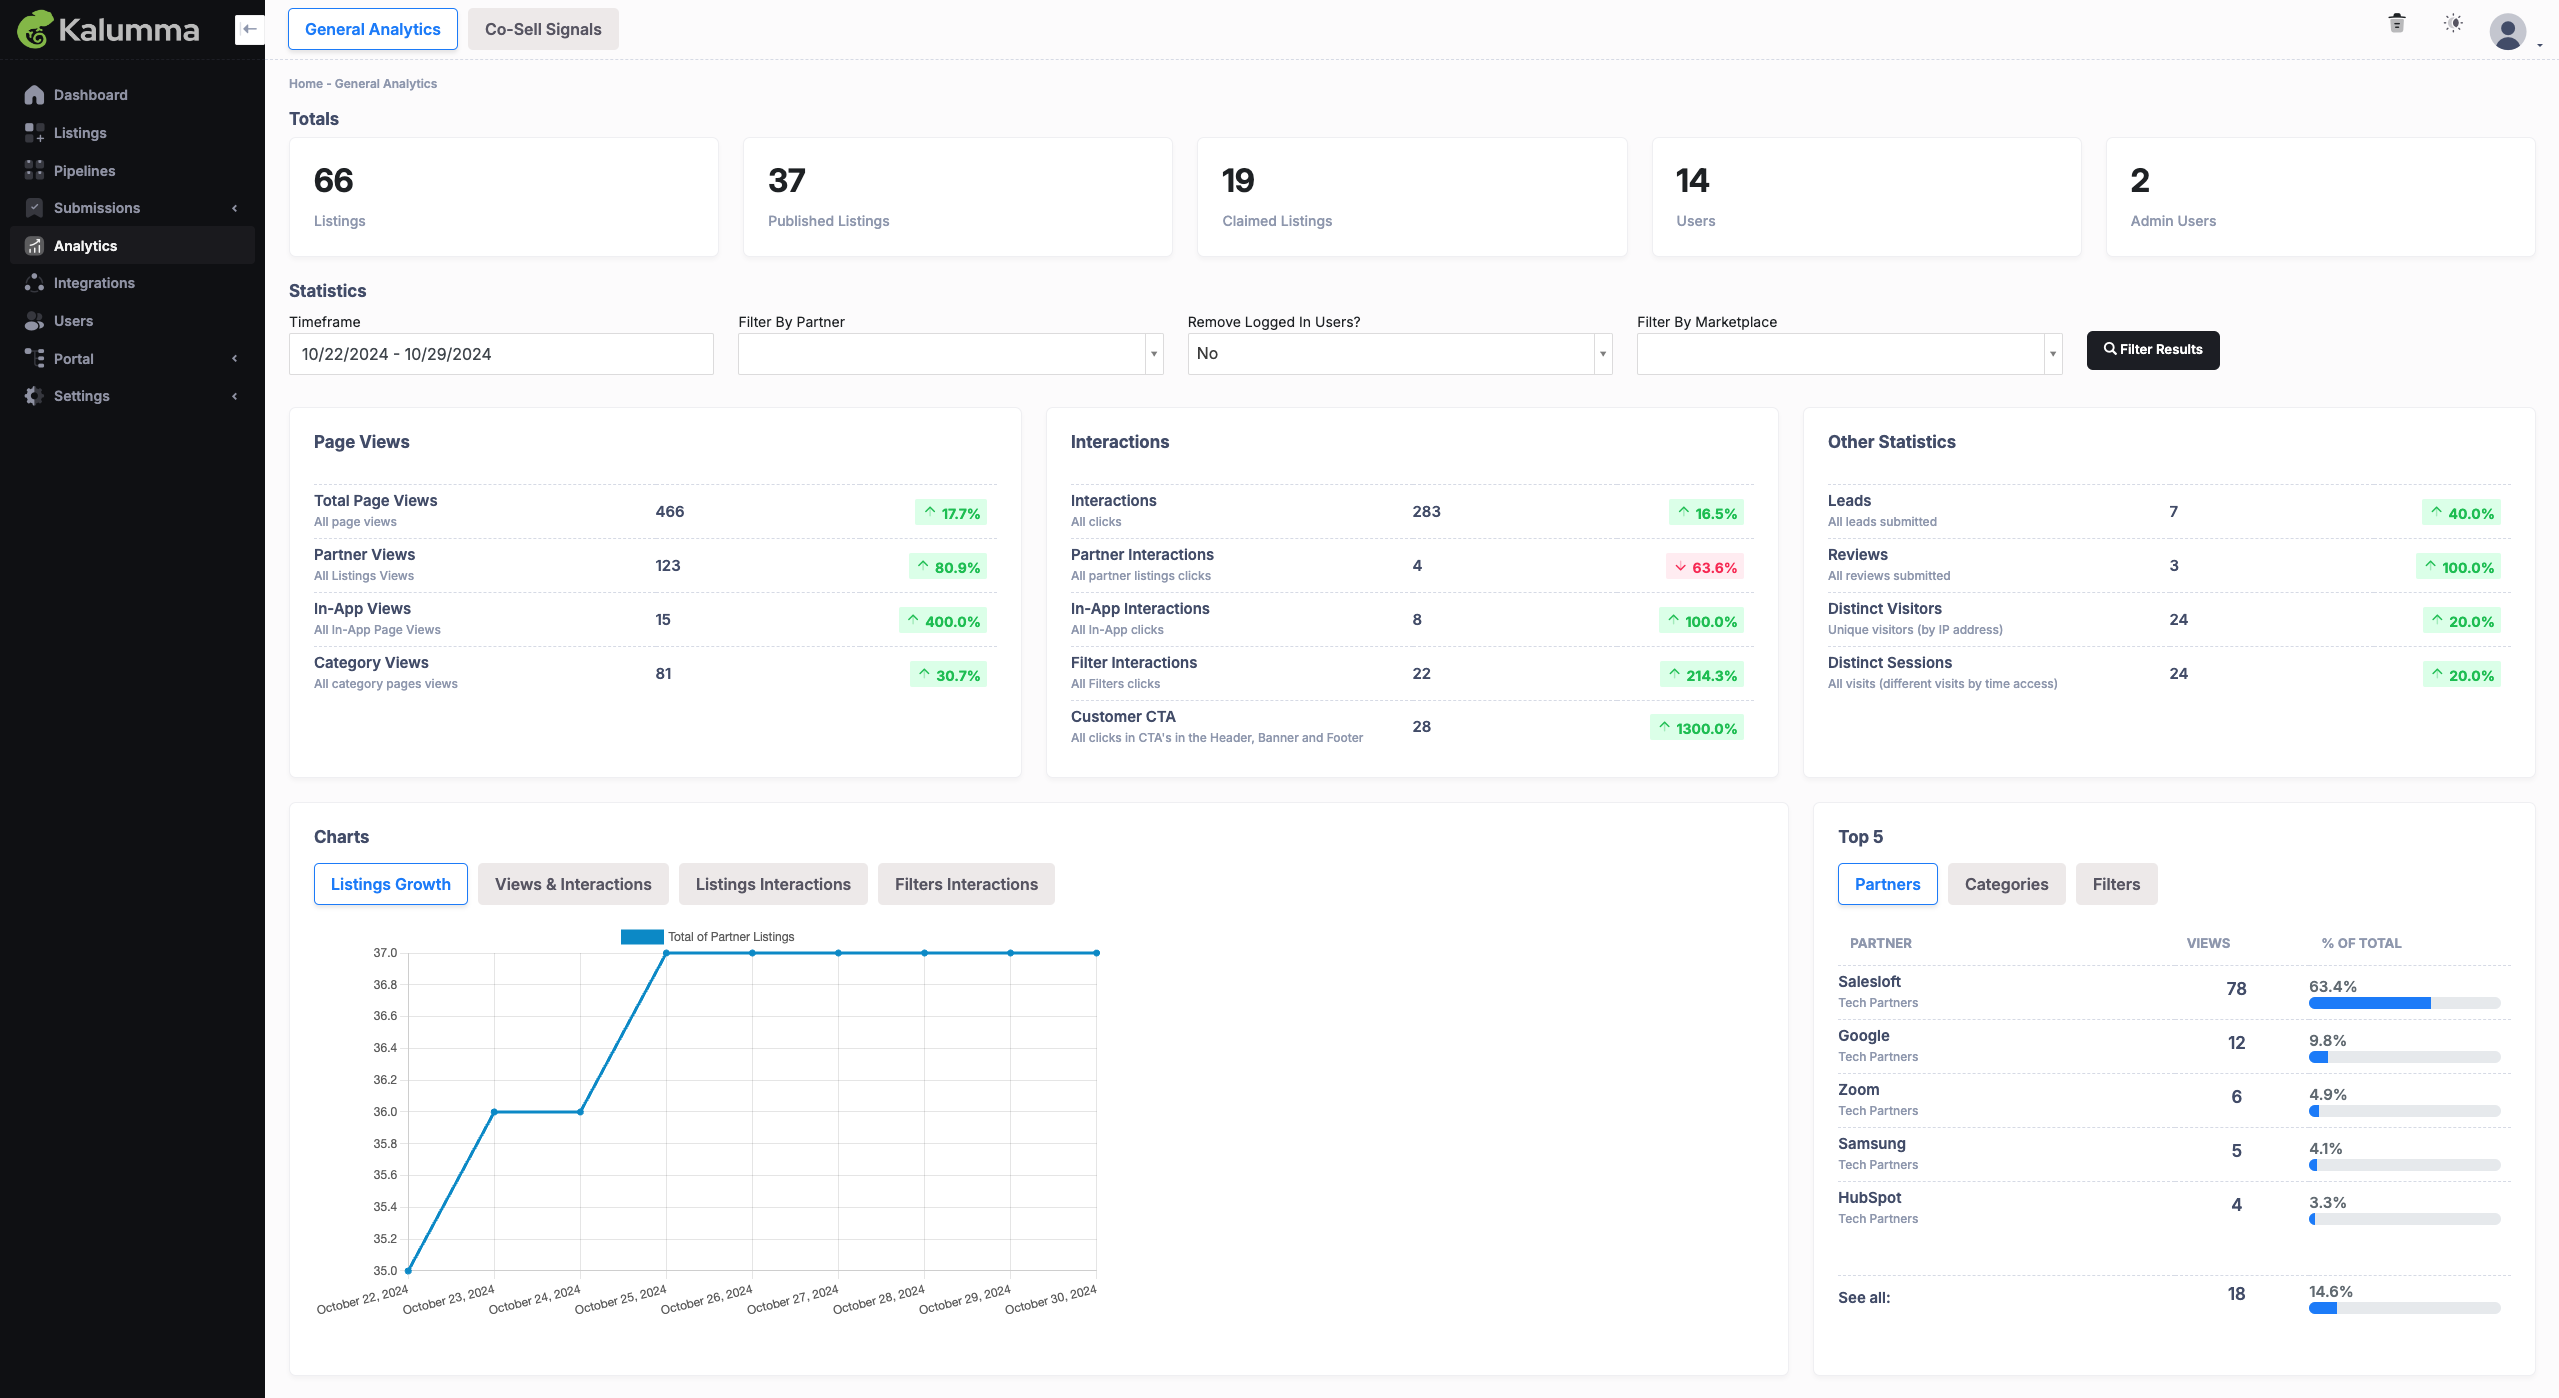
Key Sections
| Section | What it shows | How to use it |
|---|---|---|
| Totals | Inventory & user head-counts (Listings, Users, etc.) | Gauge ecosystem size at a glance. |
| Statistics Filters | Date, partner, marketplace view, and internal‑traffic filters | Slice data to the exact segment you care about. |
| Page Views | Marketplace impressions (all pages, listings, categories, in‑app) | Diagnose top‑of‑funnel reach and compare public vs in‑app traffic. |
| Interactions | Marketplace engagement (all tracked clicks) | Measure click‑through & listing stickiness; rising clicks signal healthy interest. |
| Other Statistics | Leads from forms, customer reviews, distinct visitors (unique IPs) | Tie marketplace activity to pipeline and social‑proof KPIs. |
| Charts | Trend lines for listings, views, clicks, filter use | Spot growth patterns or sudden dips that need investigation. |
| Top 5 Insights | Leaderboards for Partners, Categories, Filters, Traffic Sources | Identify winners quickly; celebrate partners and focus marketing spend. |
Green ▲ means growth vs the previous period; red ▼ means decline.
Totals

| Metric | What it counts | Why it matters |
|---|---|---|
| Listings | All partner listings, any status | Gauge marketplace size |
| Published listings | Listings visible to visitors | Track live catalogue breadth |
| Claimed listings | Listings managed by partners | Measure partner engagement |
| Users | All registered users | Understand community size |
| Admin users | Users with admin rights | Internal admin access |
Statistics Filters

Timeframe – set to past week, month, or any custom dates.
Filter By Partner – isolate one listing for a QBR.
Remove Logged‑in Users? – exclude internal traffic for clean external numbers.
Filter By Marketplace View – compare public vs in‑app analytics if you run both.
Tap Filter Results to refresh every card, chart, and list.
Page Views
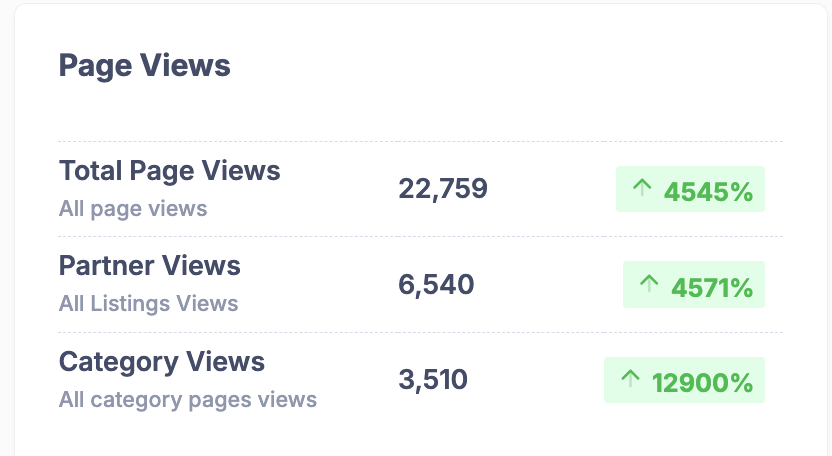
| Metric | What it counts | Why it matters |
|---|---|---|
| Total Page Views | Every impression on any marketplace page. | Track overall awareness trajectory. |
| Partner Views | Views of individual listing pages. | Identify listings worth spotlighting. |
| In-App Views (if applicable) | Impressions inside embedded marketplace. | Compare in-app vs public traffic mix. |
| Category Views | Views of category index pages. | Validate taxonomy usefulness. |
Interactions
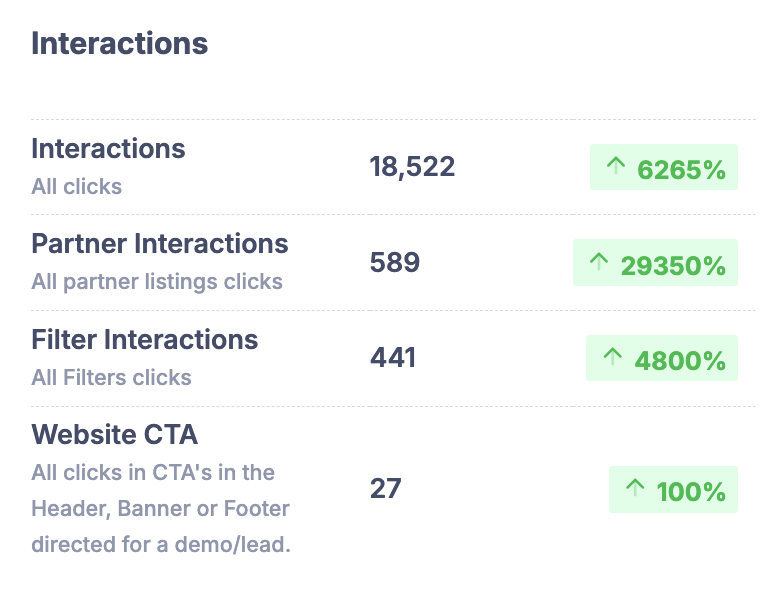
| Metric | What it counts | Why it matters |
|---|---|---|
| Interactions | Sum of every tracked click. | Quick engagement health check. |
| Partner Interactions | Clicks within listing pages (videos, CTAs). | Judge listing stickiness. |
| In-App Interactions (if applicable) | Clicks inside embedded view. | Ensure embedded users are active. |
| Filter Interactions | Clicks on filter /categories. | Understand how users narrow choices. |
| Website CTA | Clicks to your lead/demo CTAs. | Shows how many visitors click from the marketplace to your demo/lead CTA. |
Other Statistics
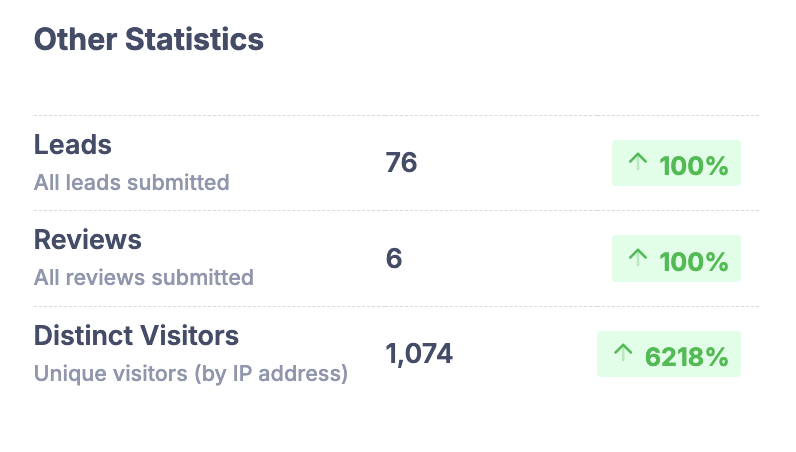
| Metric | What it counts | Why it matters |
|---|---|---|
| Leads | All lead-form submits. | Track pipeline sourced by marketplace. |
| Leads from Partners | Submits made by partners. | Monitor partner-initiated demand. |
| Reviews | Customer reviews posted. | Monitor social proof generation. |
| Distinct Visitors | Unique IPs in selected range. | Compare reach vs repeat visits. |
Charts
Choose a tab under Charts to reveal the visual you need.
| Tab | What it shows | Use it to... |
|---|---|---|
| Listing Growth | Published‑listing count over time | Monitor onboarding momentum |
| Views & Interactions | Traffic vs clicks on one graph | Check if traffic converts into engagement. |
| Listings Interactions | Click depth per listing | Spot listing sections that get the most engagement |
| Filters Interactions | Filter usage volume | Optimize taxonomy/filters that don’t get used. |
Top 5 Leaderboards
A quick snapshot of who or what performs best
| Tab | What it shows | Use it to... |
|---|---|---|
| Partners | Most-viewed listings. | Celebrate top performers; share best-practice content tips. |
| Categories | Most-visited categories. | Double-down on high-interest areas. |
| Filters | Most-used filters/tags. | Validate taxonomy relevance. |
| Traffic Sources | Referrers driving visits. | Invest marketing where it works. |
Updated about 1 year ago